Gene tools
Contents
Home page
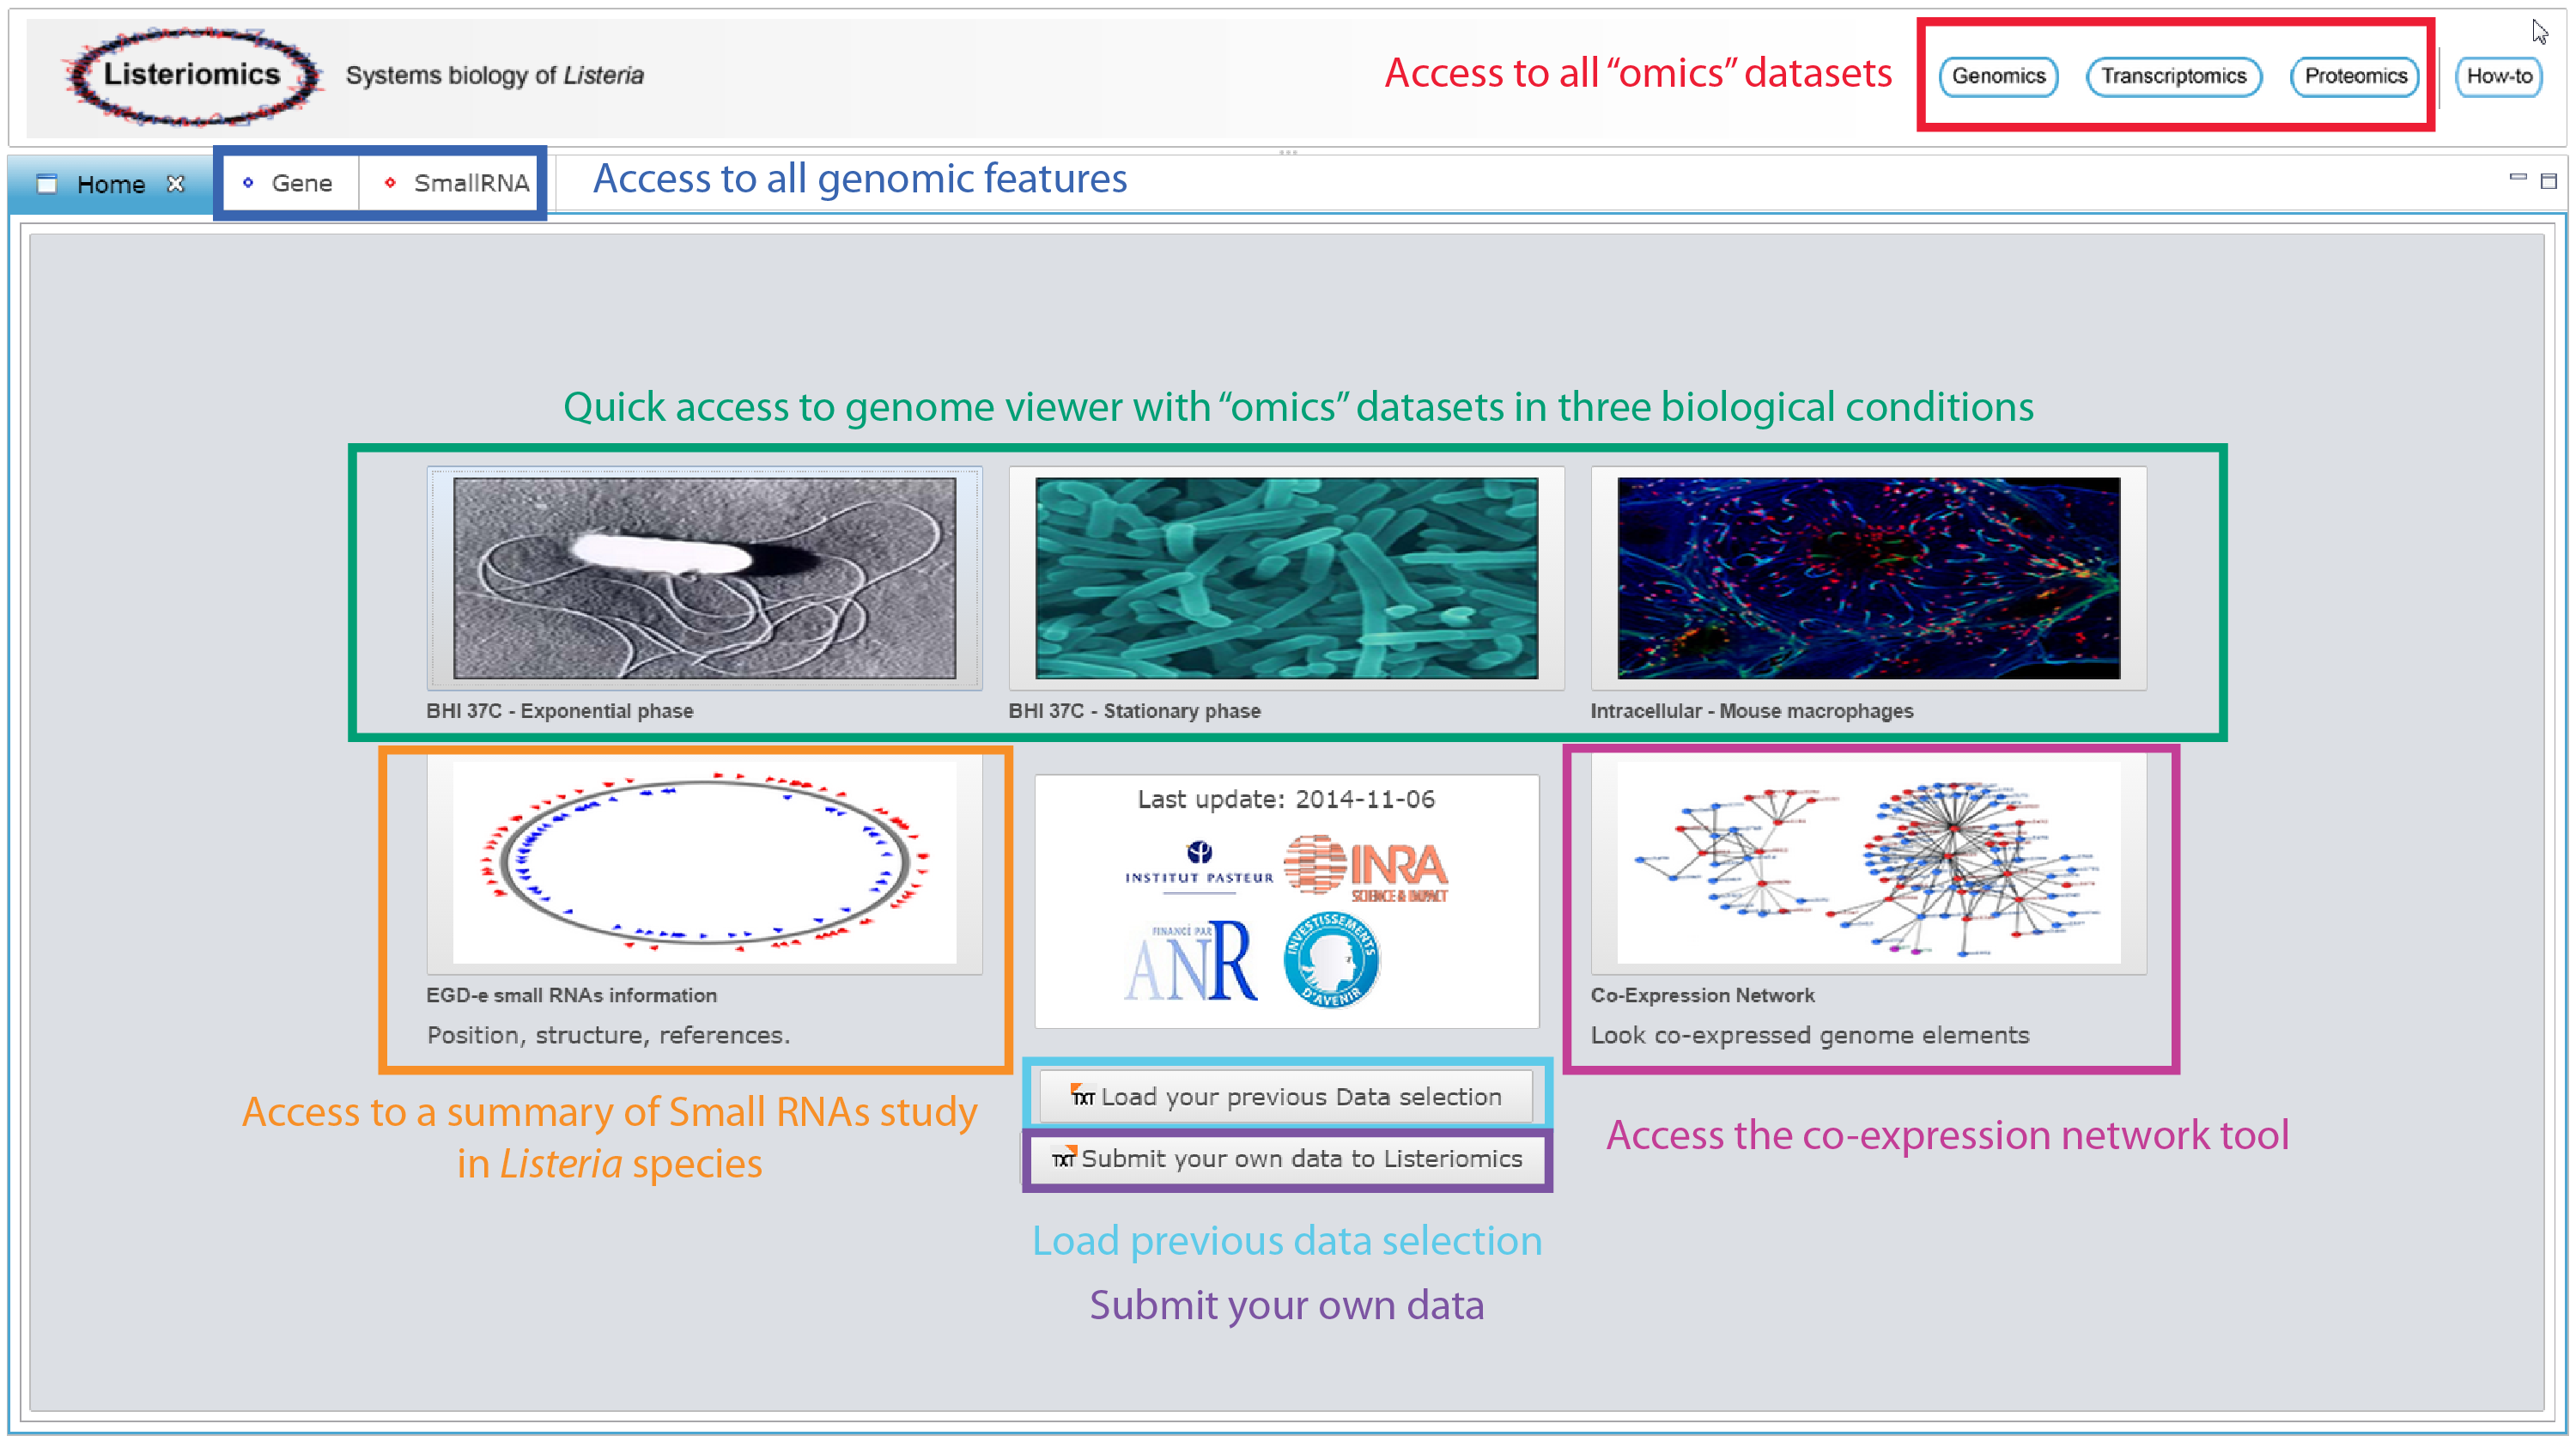
Through the home page of the Listeriomics website different tools can accessed.
Access to all "omics" datasets
| Genomics button
It gives access the genomic tool which is designed to browse through every complete genome available. One can access strain name, serotype, lineage, and isolation information, along with a complete phylogram of the Listeria strains. By double clicking on a strain the list of annotated genes will appear in a new summary panel. | |
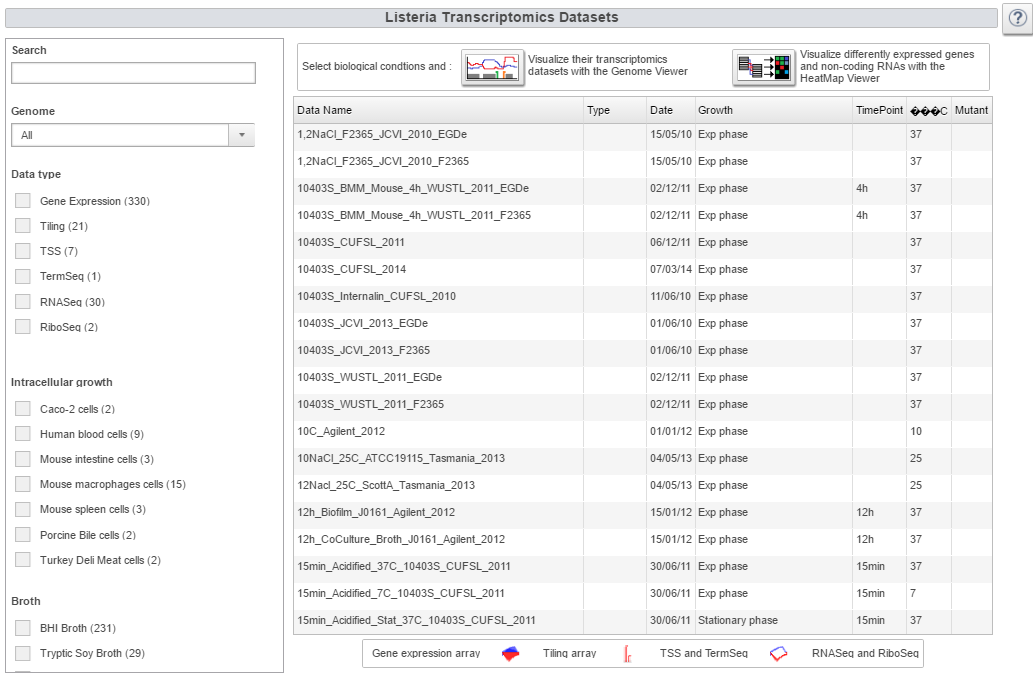
| Transcriptomics button
A summary table shows every dataset available and a precise description of the biological conditions used to generate them. Filters are available to select a particular type of biological condition and data. A vast variety of datasets are available. In total, 4 different types of technology (Gene Expression array, Tiling array, RNASeq, TSS) are included for 7 different Listeria monocytogenes strains grown in 4 different broth media and 7 intracellular conditions. | |
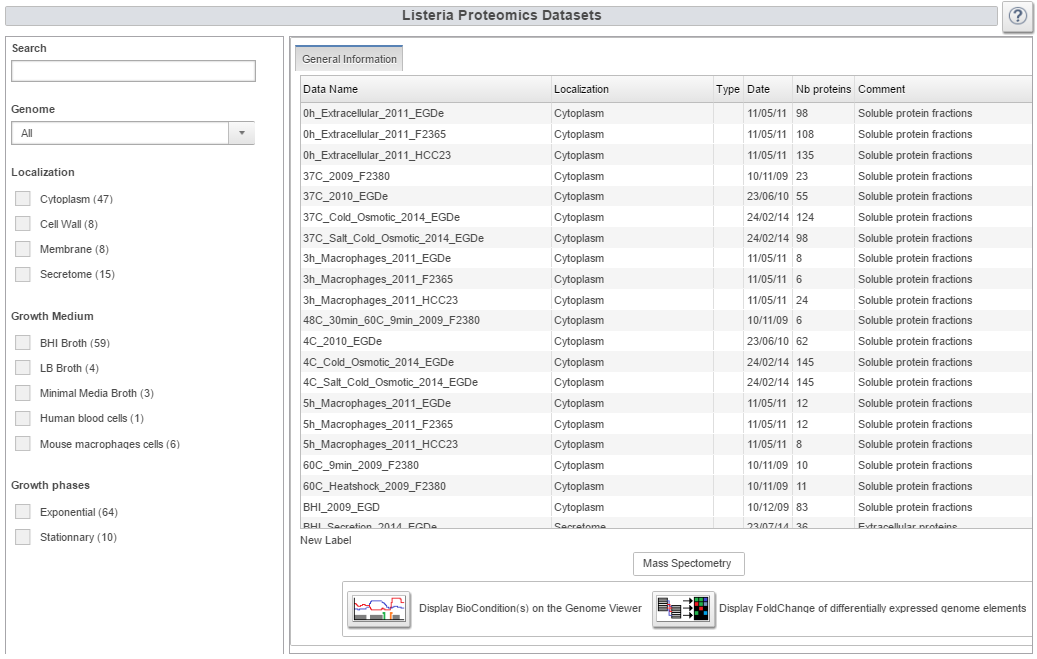
| Proteomics button
It gives access to a summary table of the 74 proteomics datasets. Once datasets are selected one can visualize them through a heatmap showing the presence or absence of each Listeria protein in a specific biological condition. Finally, each proteomic dataset can be displayed on the genome viewer along with transcriptomic datasets. |
Access to all genomics features
| Gene panel
For each Listeria gene four different information panels are available. The first one gives all general information about the position of the gene, possible annotated function, nucleotide sequence and amino-acid sequence. The second panel provides an instant view of the conservation of a specific gene in other Listeria strains. It dynamically displays on the Listeria phylogram presence of absence of homolog to the selected gene in each existing Listeria strain. It also displays a summary table of all homologs with their similarity percentages and amino acid sequences. One can then create a multi-alignment file of the homologs. A third panel uses the expression atlas to show in which transcriptomics datasets the selected gene is differently expressed. The cut-off on the Log(Fold Change) value for detecting such elements can be changed by the user. Finally the fourth panel displays every proteomics dataset in which the protein coded by the selected gene has been detected. | |
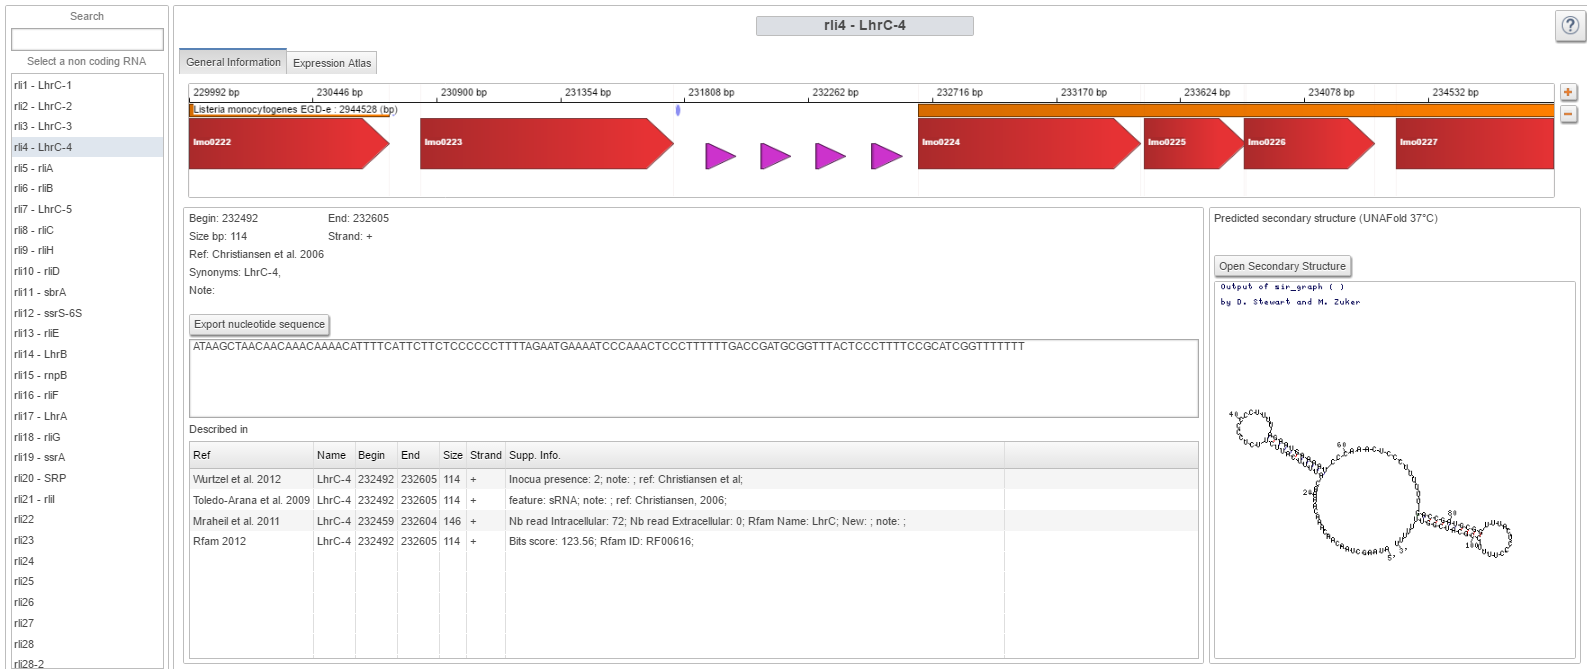
| Small RNA panel
For each RNA element it displays their positions, nucleotide sequence and predicted secondary structure at 37°C. Additionally, a table displays all the supplementary information provided with each small RNA discovery in Listeria . This gives a way to control to what extent a specific RNA has been observed in the different publications. A second panel uses the expression atlas to show in which transcriptomics datasets the selected small RNA is differently expressed. The cut-off on the Log(Fold Change) value for detecting such elements can be changed by the user. |
Quick access to genome viewer with “omics” datasets in three biological conditions
| Listeria monocytogenes EGD-e grown in BHI 37°C exponential phase
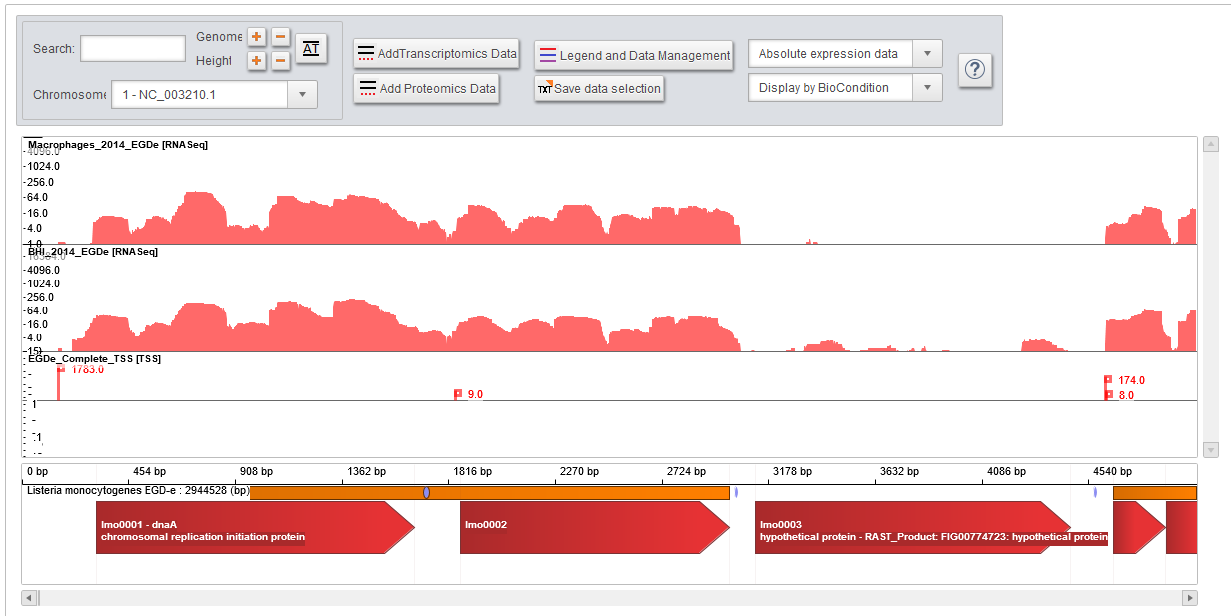
The genome of EGD-e strain is displayed with all its annotated genes, non-coding RNA, small RNA and predicted operon, along with RNASeq, transcription start sites, tiling arrays, and gene expression arrays. | |
| Listeria monocytogenes EGD-e grown in BHI 37°C exponential phase
The genome of EGD-e strain is displayed along with RNASeq, transcription start sites, tiling arrays, gene expression arrays, and proteomics data. | |
| Listeria monocytogenes EGD-e grown intracellulerly in mouse macrophage
The genome of EGD-e strain is displayed along with RNASeq, and transcription start sites. |
Other tools
| L. mono. EGD-e small RNAs information
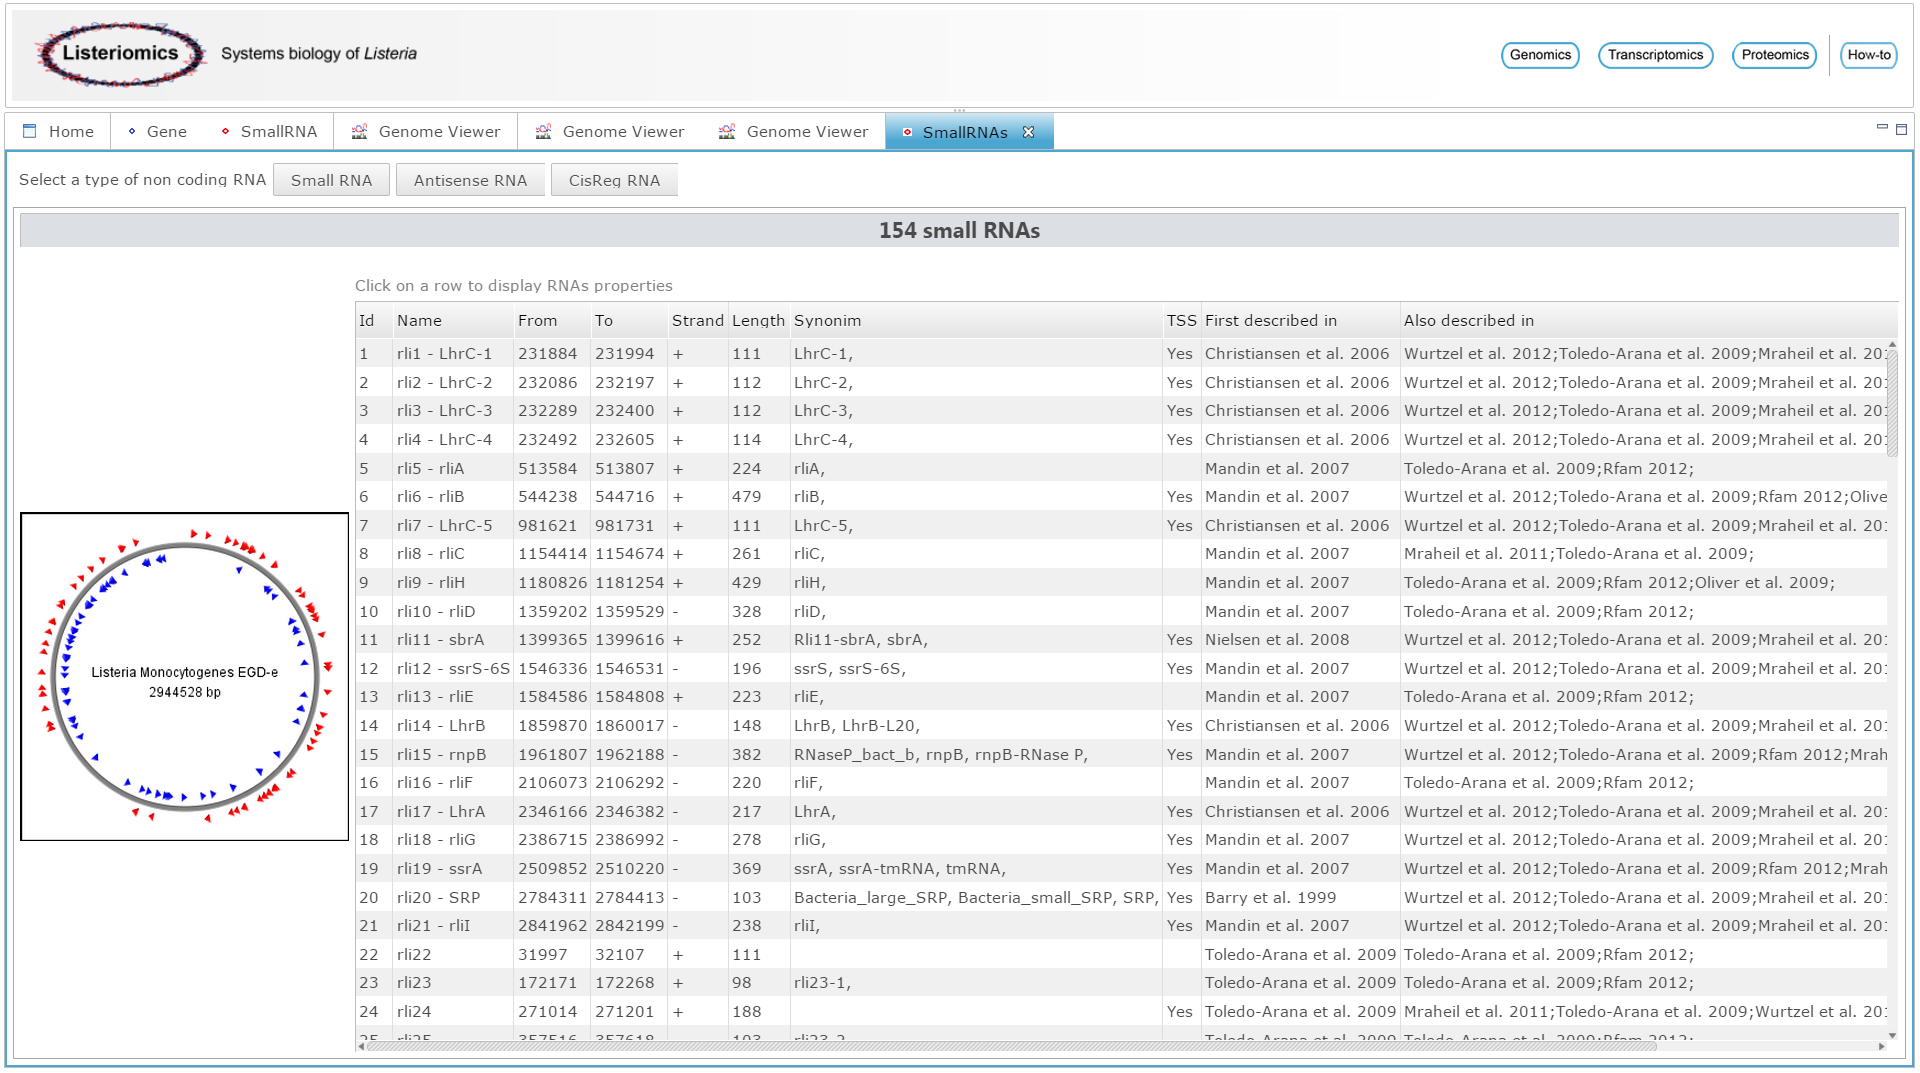
All general information about small RNAs discovery can be browsed here. By clicking on one small RNA oe can access specific small RNA panel to get more information. | |
| Load previous data selection
Dialog to load previous saved data selection to re-access quickly the data. | |
| Access to the co-expression network tool
One can select one or many genome features and discover correlations with other genome features. |
