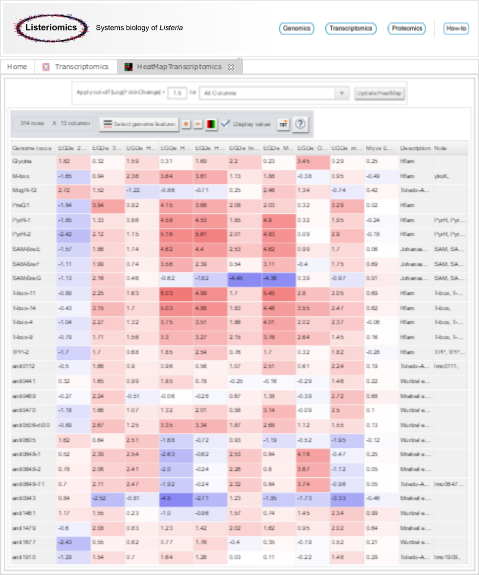
The aim of the heatmap module is to visualize gene expression fold-changes (shown as log2 values) within different biological conditions.
Force-directed graph visualization
Each line of the heatmap corresponds to a gene and each column corresponds to a comparison between two biological conditions
