General organization
The genome viewer can be accessed through many pages on the Listeriomics website. From the home webpage, from the transcriptomics and proteomics summary pages, from the gene tool webpage, and from the small RNA tool webpage.
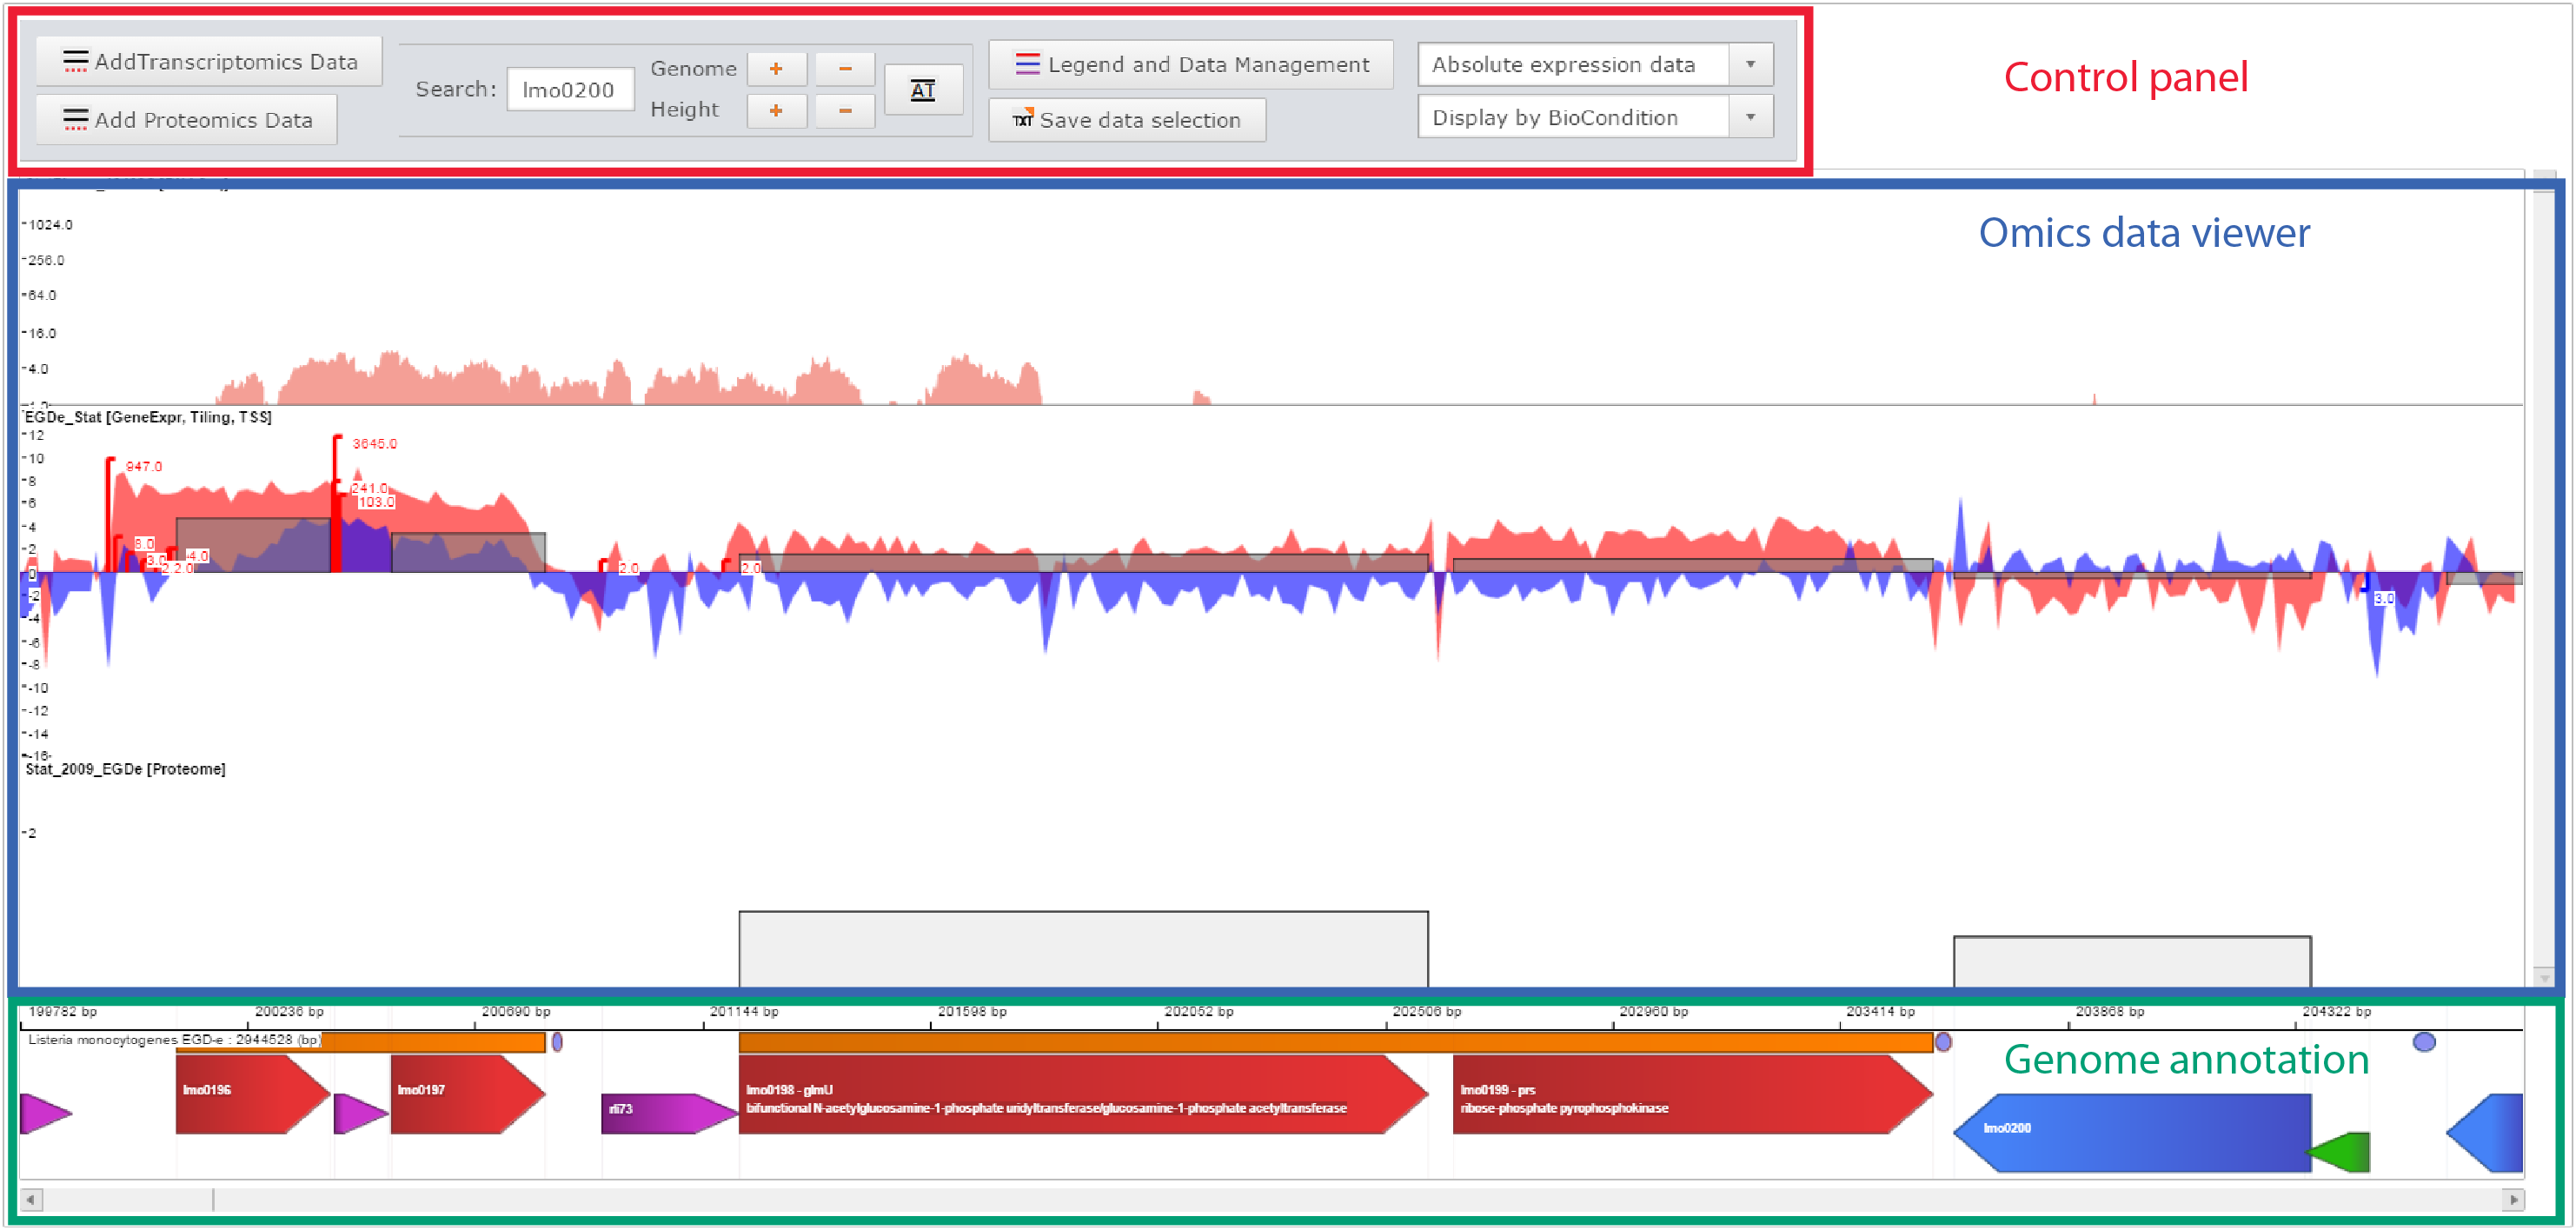 Printscreen of the Genome viewer of the Listeriomics website |
Control panel
- Add data
- Move the genome position, zoom in, zoom out
- Manage displayed datasets
Omics data viewer
The panel in which "omics" datasets are displayed
Genome annotation
All genome features available for the displayed Listeria strain genome.
|
Control panel
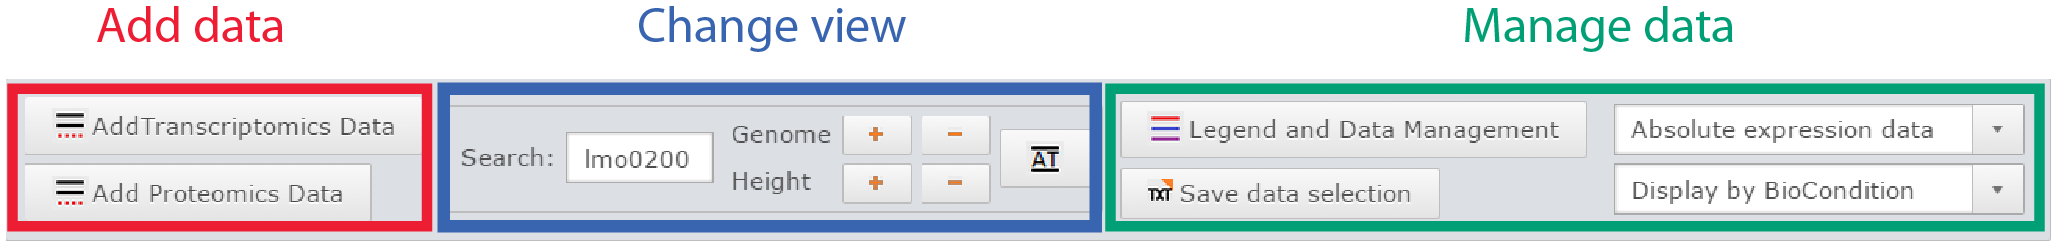
Control panel of the genome viewer
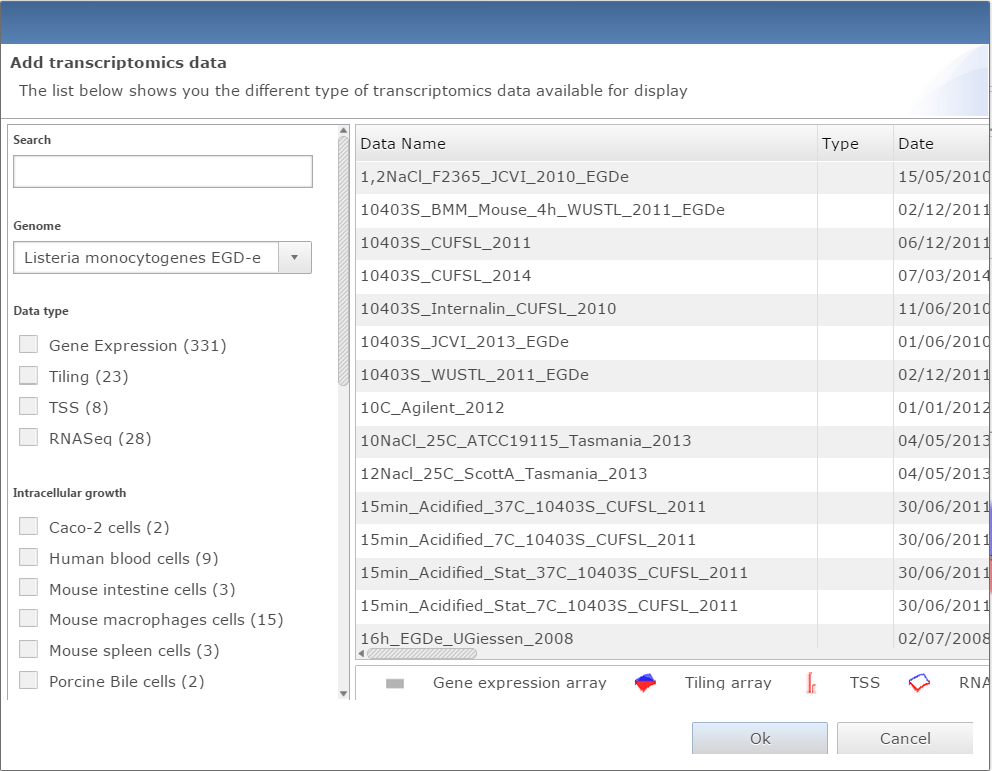 Dialog window for adding data to genome viewer |
Add data
Two buttons are available to add datasets, one for transcriptomic data, the other for proteomic. Both will open a similar dialog with all datasets available. The user can filter datasets or directly search them. Every dataset selected will be displayed on the genome viewer by clicking on the Ok button.
|
 Printscreen of the same region with different base pair scale |
Change view
- Scroll the genome by searching a specific element contained in the displayed Listeria strain genome.
- Zoom in and zoom out horizontally, to change the base pair scale of display.
- AT button gives instant access to a view at the sequence scale where DNA sequence is displayed, along with amino acid sequence in the 6 possible frames.
- Increase the height of all genome tracks.
|
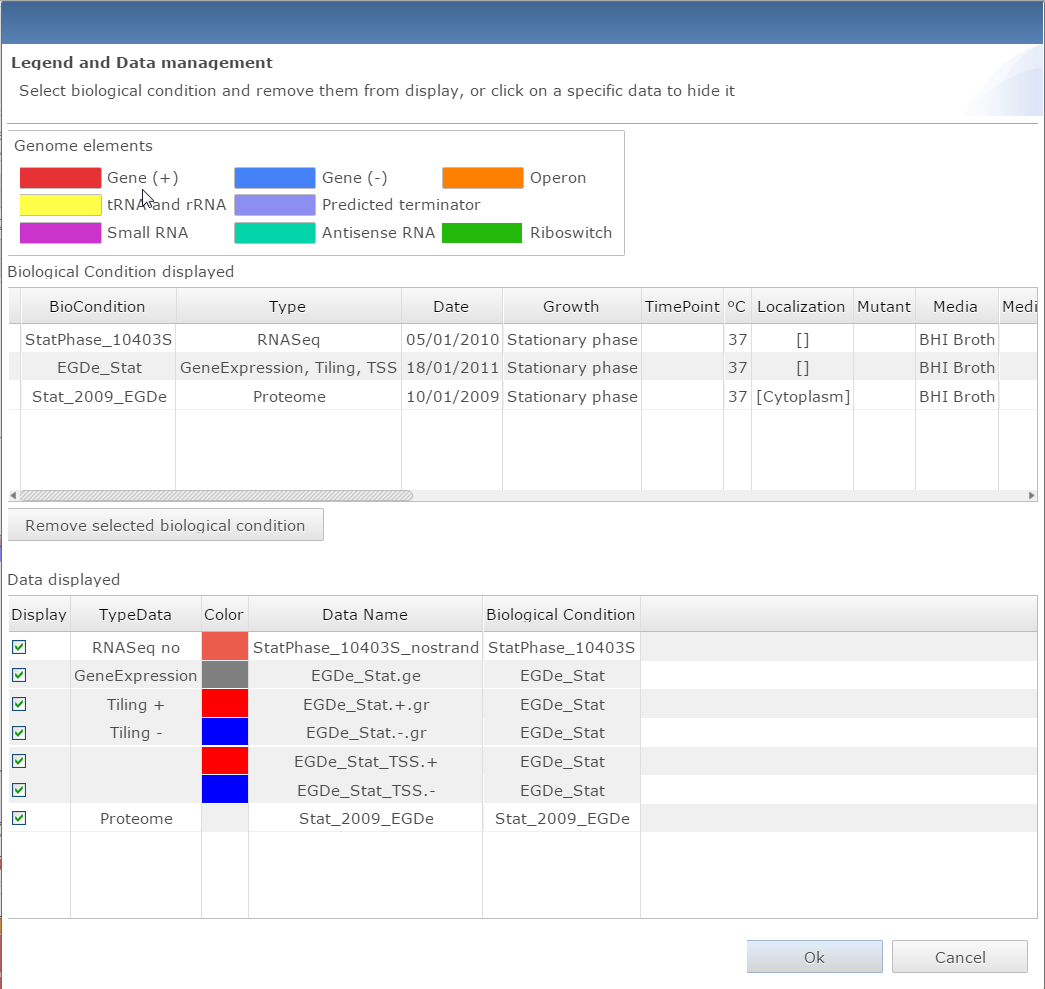 Dialog window for managind data and getting the legend for the genome viewer |
Manage data
There is 4 different buttons in this panel:
- Access the dialog window to look at the data legend and remove specific datasets from the view
- Save in text file the current genome viewer properties
- Change the display between absolute expression data (Log(expression)) to relative expression data (Log(Fold Change))
- Select one of the three representation types: Display by biological condition, by dataset, or overlap all dataset on one single track.
|
Omics data viewer
 Omics data viewer of the genome viewer |
The genome viewer will always display "omics" dataset in that order:
- RNASeq data
- Tiling array
- Gene expression array
- Transcription Start Site (TSS) data
- Proteomic data:
For each track the name of the dataset displayed is shown on the top left. The grey line in the middle of each track is the value 0. If the name of the dataset contains " vs " it means it is a relative expression dataset, thus Log(Fold Change) values are displayed. The type of data displayed are written at the end of each dataset name on the top left of each track.
When the height of the view has been increased or decrease using the Height zoom the vertical slider will be used to move from one dataset to the other.
|
Genome annotation

Genome annotation panel of the genome viewer
Genome annotation panel of the genome viewer |
Click on Expression Atlas on the Omics selection panel
- Base pair condition: Select the value of Log(Fold Change) used to detect differential expression.
- Genome annotation: Display selected datasets in the genome viewer in which the small RNA will be highlighted.
- Move view horizontally: List of relative value expression data in which the small RNAis over-expressed (i.e. Log(FC) > cut-off).
|


