General organization
The genome viewer can be accessed through many pages on the Listeriomics website. From the home webpage, from the transcriptomics and proteomics summary pages, from the gene tool webpage, and from the small RNA tool webpage.
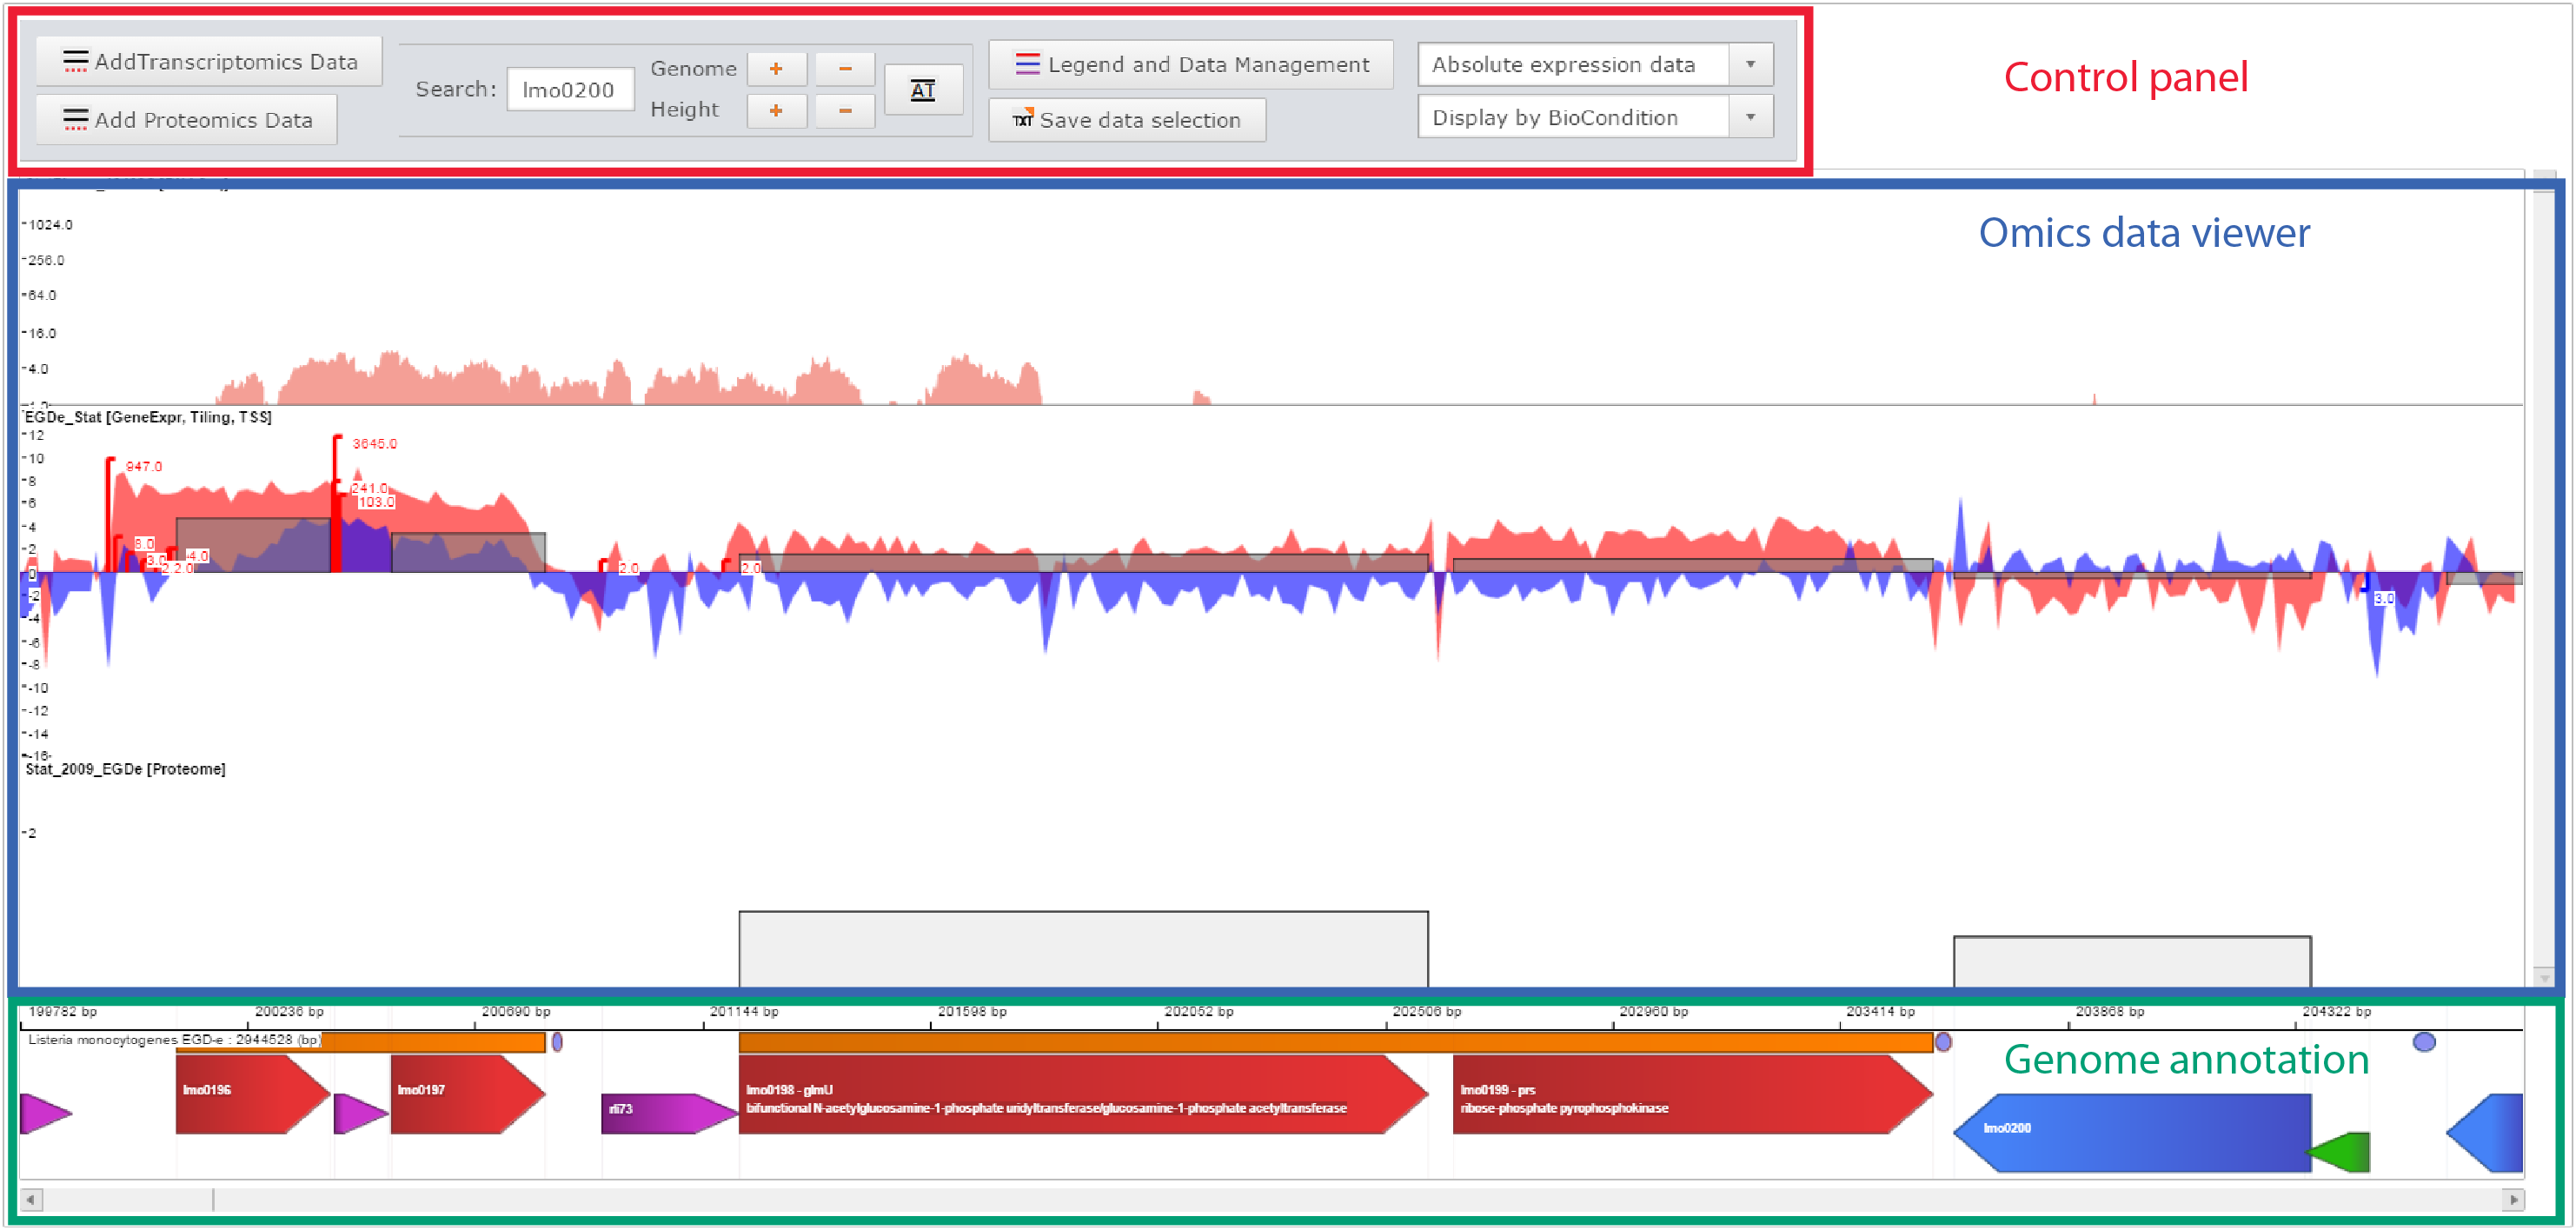
Printscreen of the Genome viewer of the Listeriomics website
| Control panel
Here one can :
- Add data
- Move the genome position, zoom in, zoom out
- Manage displayed datasets
|
| Omics data viewer
The panel in which "omics" datasets are displayed
|
| Genome annotation
All genome features available for the displayed Listeria strain genome.
|
Control panel
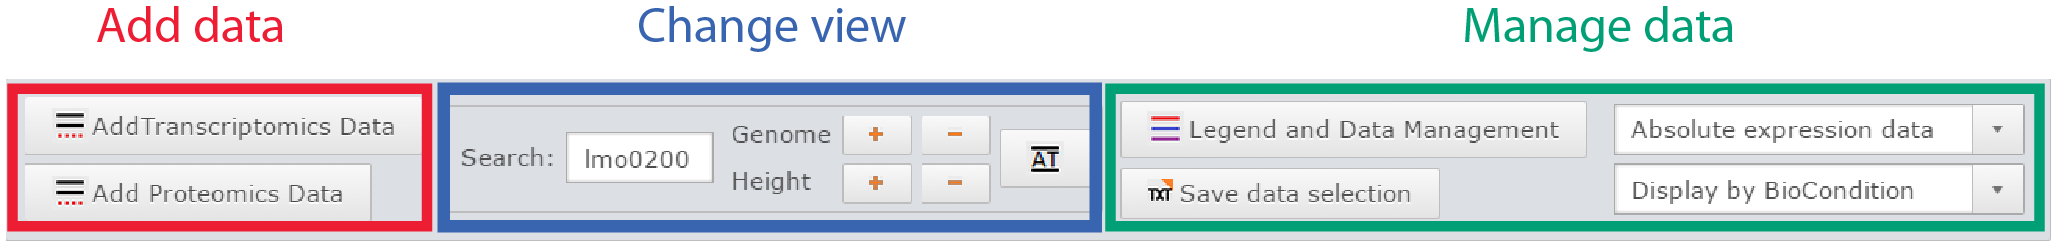
Control panel of the genome viewer
Click on General information on the Omics selection panel
- Genome viewer: Displays the small RNA in the genome viewer to see surrounding genome features.
- General information: Every general information available on small RNA position, and study in which it was discovered.
- Supplementary information: All supplementary information available from all the studies in which the small RNA was detected.
- Sequences: DNA and amino acid sequences are available here for copy/paste.
- Sequences: Predicted secondary structure at 37°C of the small RNA using UNAFold software.
|
Omics data viewer
 Omics data viewer of the genome viewer |
Click on Expression Atlas on the Omics selection panel
- Cut-off selection: Select the value of Log(Fold Change) used to detect differential expression.
- Send to Genome viewer of Heatmap viewer: Display selected datasets in the genome viewer in which the small RNA will be highlighted, or to the heatmap viewer to show the values of Log(Fold-change).
- Datasets in which the gene is over-expressed: List of relative value expression data in which the small RNAis over-expressed (i.e. Log(FC) > cut-off).
- Datasets in which the gene is under-expressed: List of relative value expression data in which the small RNAis under-expressed (i.e. Log(FC) < - cut-off).
- Datasets in which the gene has no differential expression: List of relative value expression data in which the small RNAis not differentially expressed (i.e. - cut-off < Log(FC) < cut-off).
|
Genome annotation
 Genome annotation panel of the genome viewer |
Click on Expression Atlas on the Omics selection panel
- Cut-off selection: Select the value of Log(Fold Change) used to detect differential expression.
- Send to Genome viewer of Heatmap viewer: Display selected datasets in the genome viewer in which the small RNA will be highlighted, or to the heatmap viewer to show the values of Log(Fold-change).
- Datasets in which the gene is over-expressed: List of relative value expression data in which the small RNAis over-expressed (i.e. Log(FC) > cut-off).
- Datasets in which the gene is under-expressed: List of relative value expression data in which the small RNAis under-expressed (i.e. Log(FC) < - cut-off).
- Datasets in which the gene has no differential expression: List of relative value expression data in which the small RNAis not differentially expressed (i.e. - cut-off < Log(FC) < cut-off).
|


