General organization
The small RNA webpage can be accessed either from the home webpage of the Listeriomics website or by double-clicking on a small RNA in the genome viewer.
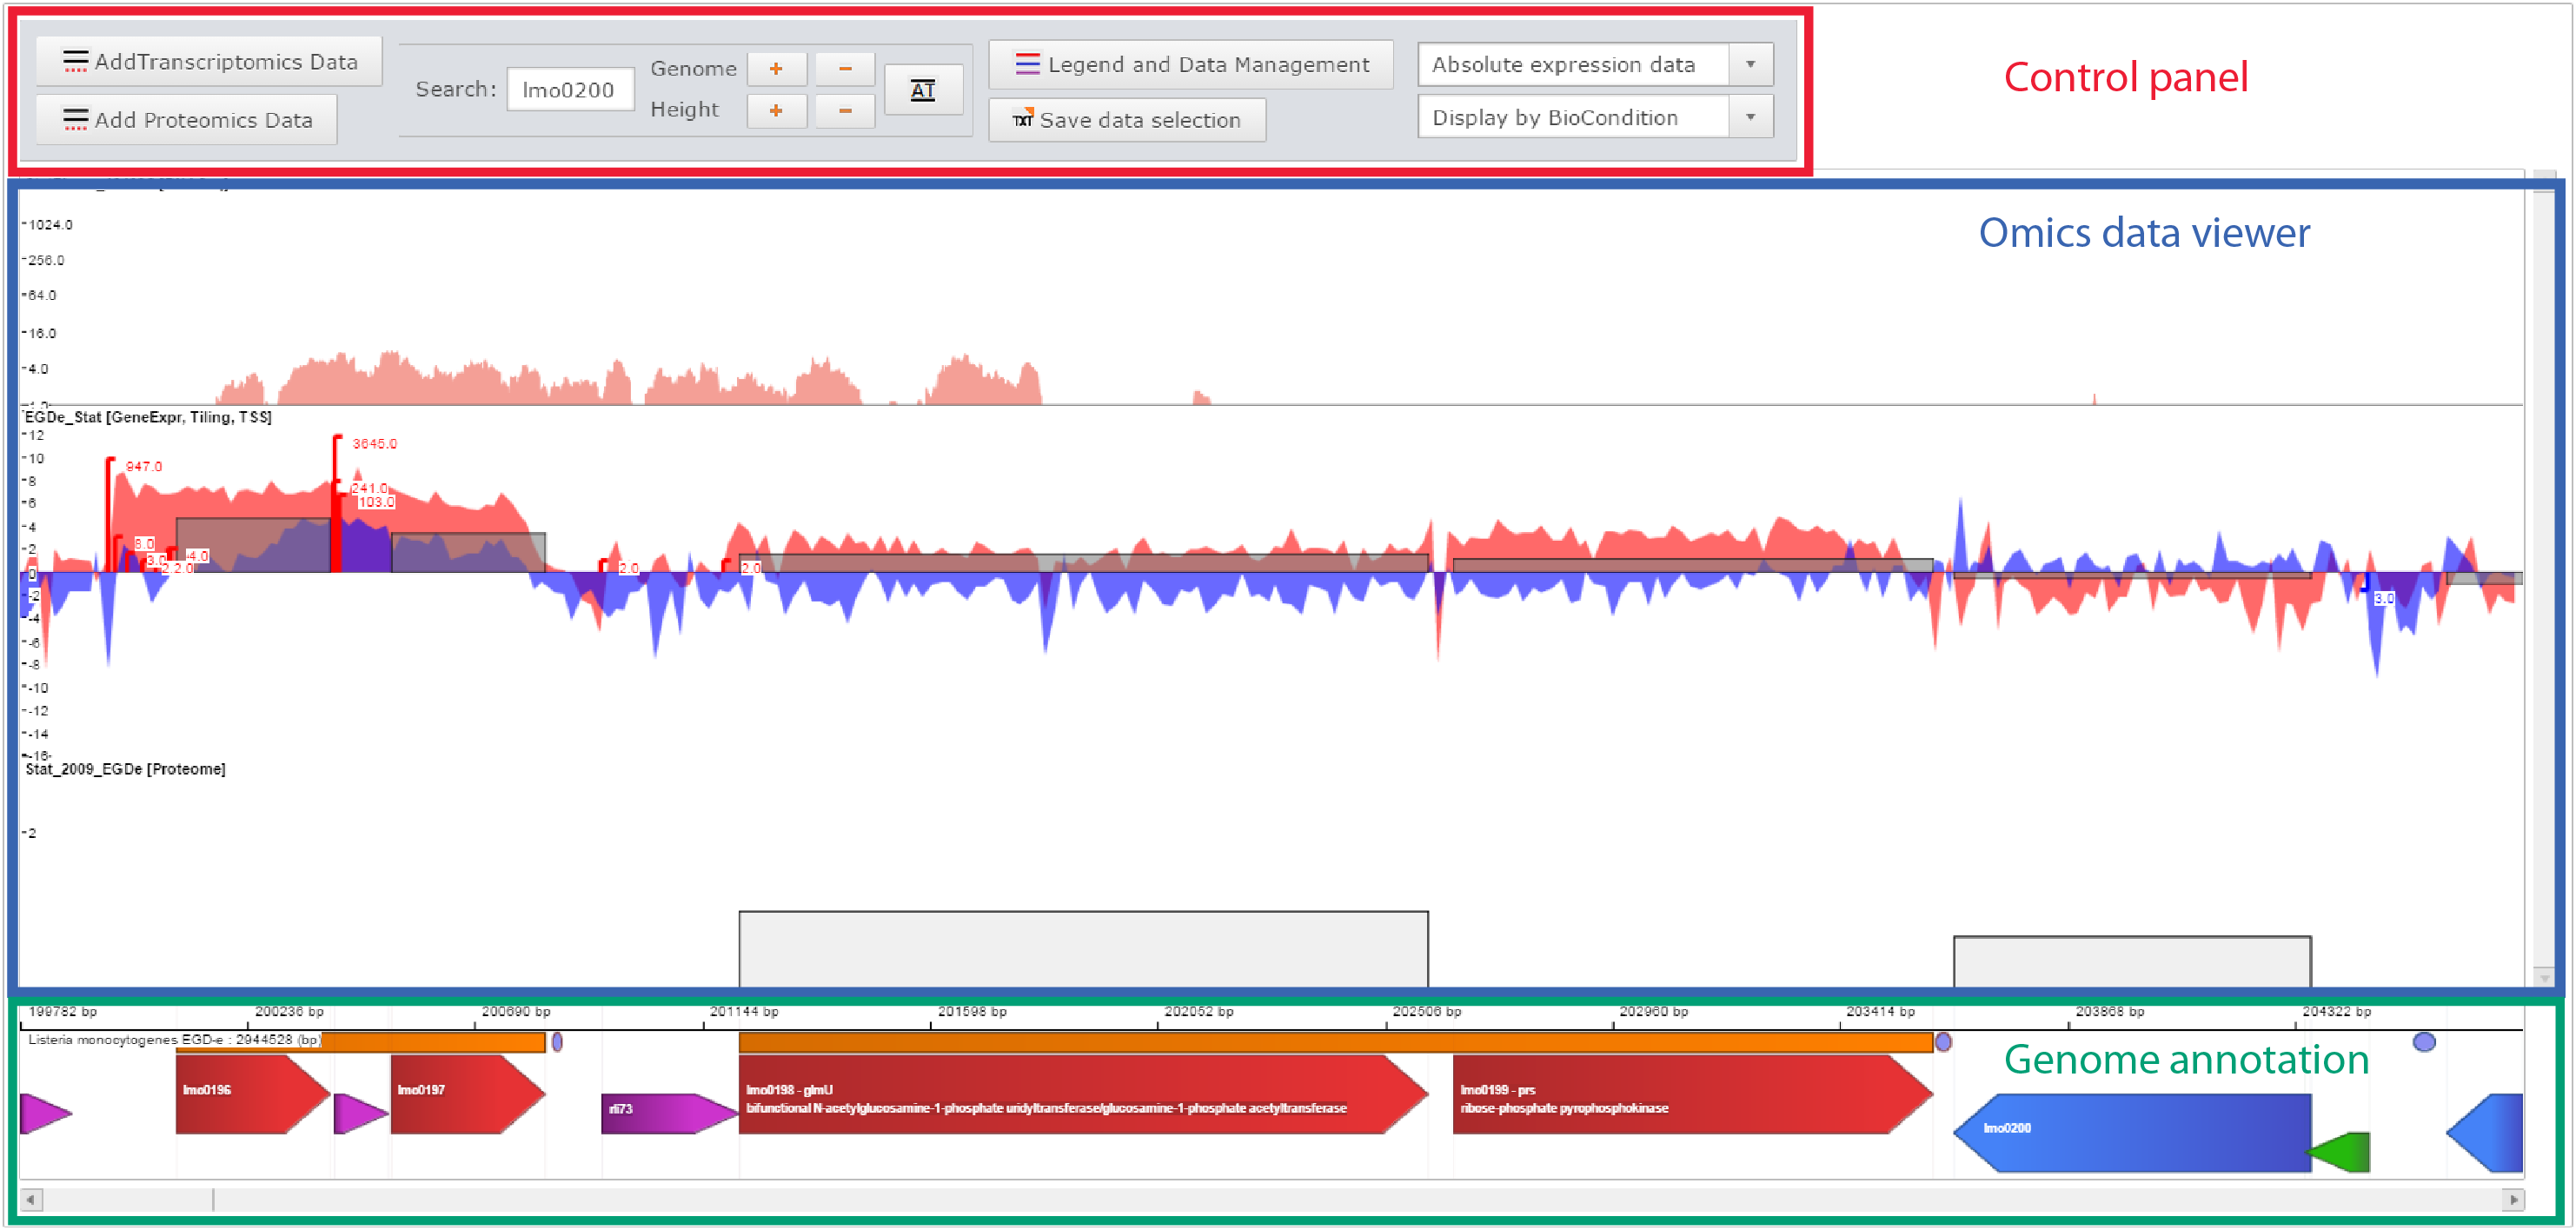
Printscreen of the Genome viewer of the Listeriomics website
| Control panel
In this list, all the small RNA available in Listeria monocytogenes EGD-e strain are displayed. One can search for a small RNA. A click on an element of the list will display all related information on the Small RNA information panel.
|
| Omics data viewer
For each Listeria small RNA two different information panels are available.
- General information: The position of the small RNA, possible regulation, DNA sequence and predicted secondary structure.
- Expression atlas: It shows in which transcriptomics datasets the selected small RNA is differently expressed. The cut-off on the Log(Fold Change) value for detecting such elements can be changed by the user.
|
| Genome annotation
The panel in which all information will be displayed
|
Control panel
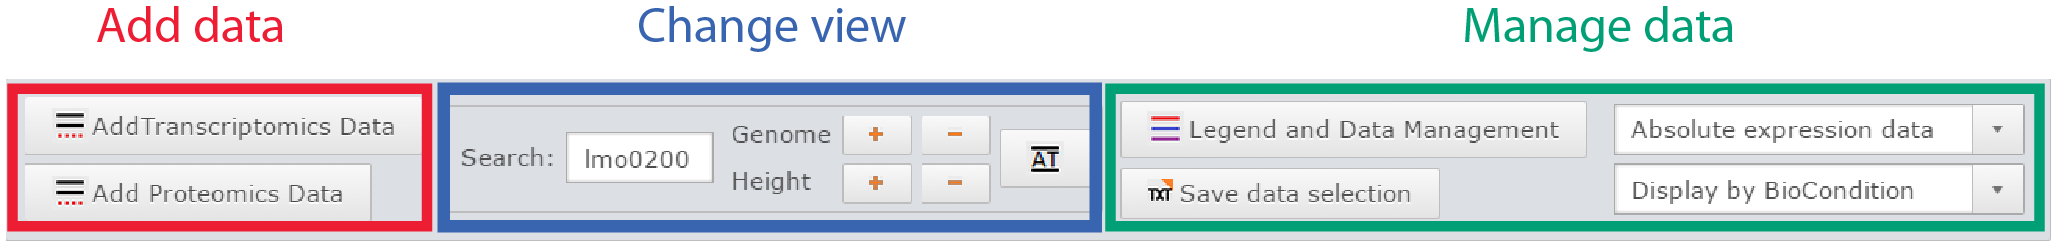 Control panel of the genome viewer |
Click on General information on the Omics selection panel
- Genome viewer: Displays the small RNA in the genome viewer to see surrounding genome features.
- General information: Every general information available on small RNA position, and study in which it was discovered.
- Supplementary information: All supplementary information available from all the studies in which the small RNA was detected.
- Sequences: DNA and amino acid sequences are available here for copy/paste.
- Sequences: Predicted secondary structure at 37°C of the small RNA using UNAFold software.
|
Omics data viewer
 Omics data viewer of the genome viewer |
Click on Expression Atlas on the Omics selection panel
- Cut-off selection: Select the value of Log(Fold Change) used to detect differential expression.
- Send to Genome viewer of Heatmap viewer: Display selected datasets in the genome viewer in which the small RNA will be highlighted, or to the heatmap viewer to show the values of Log(Fold-change).
- Datasets in which the gene is over-expressed: List of relative value expression data in which the small RNAis over-expressed (i.e. Log(FC) > cut-off).
- Datasets in which the gene is under-expressed: List of relative value expression data in which the small RNAis under-expressed (i.e. Log(FC) < - cut-off).
- Datasets in which the gene has no differential expression: List of relative value expression data in which the small RNAis not differentially expressed (i.e. - cut-off < Log(FC) < cut-off).
|
Genome annotation
 Genome annotation panel of the genome viewer |
Click on Expression Atlas on the Omics selection panel
- Cut-off selection: Select the value of Log(Fold Change) used to detect differential expression.
- Send to Genome viewer of Heatmap viewer: Display selected datasets in the genome viewer in which the small RNA will be highlighted, or to the heatmap viewer to show the values of Log(Fold-change).
- Datasets in which the gene is over-expressed: List of relative value expression data in which the small RNAis over-expressed (i.e. Log(FC) > cut-off).
- Datasets in which the gene is under-expressed: List of relative value expression data in which the small RNAis under-expressed (i.e. Log(FC) < - cut-off).
- Datasets in which the gene has no differential expression: List of relative value expression data in which the small RNAis not differentially expressed (i.e. - cut-off < Log(FC) < cut-off).
|


